Growing odds of a Gaza ceasefire has seen Crude Oil tumble. (Pivot Orderbook analysis)
…
This is a premium post.
[s2If !current_user_can(access_s2member_level4)]Please register for FREE REGISTER to read full post below containing analysis. In case of any error or you think you are not able to read the full post below, please email us at support#nehcap.com [lwa][/s2If] [s2If current_user_can(access_s2member_level1)]
- Growing odds of a Gaza ceasefire has seen Crude Oil tumble.
- A surge in US NFP figures sent Crude Oil even lower on Friday.
- OPEC has a long road ahead of it to overcome non-OPEC production growth.
The pair currently trades last at 72.39.
The previous day high was 76.84 while the previous day low was 73.7. The daily 38.2% Fib levels comes at 74.9, expected to provide resistance. Similarly, the daily 61.8% fib level is at 75.64, expected to provide resistance.
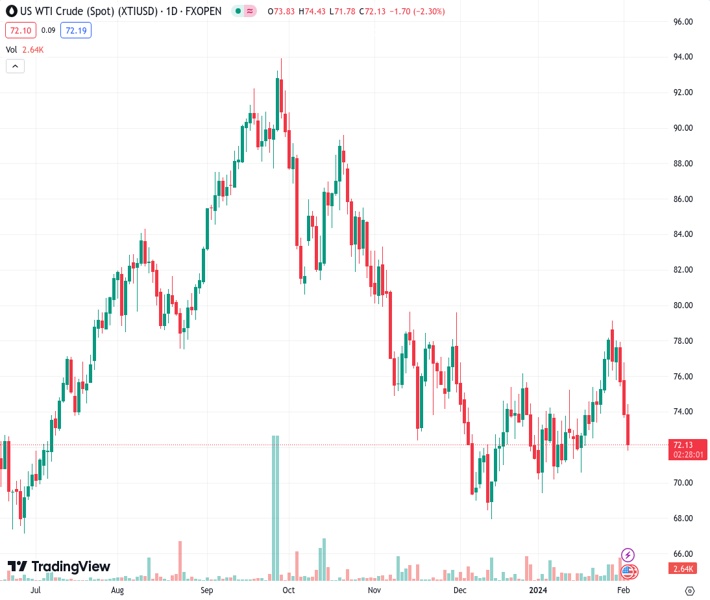
West Texas Intermediate (WTI) US Crude Oil fell into familiar lows on Friday, driven down by geopolitical fears washing out on hostage negotiations and sparks of doubt that OPEC will successfully under-produce pumping growth in the non-OPEC sphere.
Qatar is heading up efforts to negotiate a ceasefire in Gaza, if at least temporarily to allow the exchange of hostages, and Qatar’s steady success in talking down both sides of the conflict is seeing Crude oil flounder as geopolitical tensions ease.
The Organization of the Petroleum Exporting Countries (OPEC) is set to see a long-term challenge in 2024 and 2025 as OPEC tries desperately to undercut global non-OPEC production, imposing stiff production quotas on member nations as non-OPEC producers such as the US outstrip OPEC pumping caps. Analysts are increasingly concerned that the US and other non-OPEC producers could entirely oversupply global markets, and investors will be keeping a close eye on inventories in 2024.
US Nonfarm Payrolls: surge 353,000 in January
US Nonfarm Payrolls (NFP) surged to a twelve-month high of 353,000 in January, well over the market’s median forecast of 180K. With the US economy continuing to show stubborn resilience and the US labor market remaining at record highs, odds of a market-support rate cut from the US Federal Reserve (Fed) continue to decline.
WTI has extended declines and fallen even further away from the 200-hour Simple Moving Average (SMA) at $76.00 per barrel, and US Crude Oil has shed nearly 10% from its last swing high into $79.19.
WTI has declined for a third straight day and closed in the red for four of the last five trading days, facing a daily candlestick rejection from the 200-day SMA near the $78.00 handle.
Technical Levels: Supports and Resistances
XTIUSD currently trading at 72.39 at the time of writing. Pair opened at 73.82 and is trading with a change of -1.94 % .
| Overview | Overview.1 | |
|---|---|---|
| 0 | Today last price | 72.39 |
| 1 | Today Daily Change | -1.43 |
| 2 | Today Daily Change % | -1.94 |
| 3 | Today daily open | 73.82 |
The pair remains strongly bearish on the daily time frame. It trades below the 20 SMA @ 74.13, 50 SMA 73.42, 100 SMA @ 78.52 and 200 SMA @ 77.25.
| Trends | Trends.1 | |
|---|---|---|
| 0 | Daily SMA20 | 74.13 |
| 1 | Daily SMA50 | 73.42 |
| 2 | Daily SMA100 | 78.52 |
| 3 | Daily SMA200 | 77.25 |
The previous day high was 76.84 while the previous day low was 73.7. The daily 38.2% Fib levels comes at 74.9, expected to provide resistance. Similarly, the daily 61.8% fib level is at 75.64, expected to provide resistance.
Note the levels of interest below:
- Pivot support is noted at 72.73, 71.64, 69.59
- Pivot resistance is noted at 75.87, 77.92, 79.01
| Levels | Levels.1 |
|---|---|
| Previous Daily High | 76.84 |
| Previous Daily Low | 73.70 |
| Previous Weekly High | 78.20 |
| Previous Weekly Low | 72.55 |
| Previous Monthly High | 79.19 |
| Previous Monthly Low | 69.41 |
| Daily Fibonacci 38.2% | 74.90 |
| Daily Fibonacci 61.8% | 75.64 |
| Daily Pivot Point S1 | 72.73 |
| Daily Pivot Point S2 | 71.64 |
| Daily Pivot Point S3 | 69.59 |
| Daily Pivot Point R1 | 75.87 |
| Daily Pivot Point R2 | 77.92 |
| Daily Pivot Point R3 | 79.01 |
[/s2If]
Nehcap Trading Strategies
The NEHCAP currently runs the following trading systems for clients. They can be bought and run on your funds.
The system is trading live: LIVE ACCOUNT TRACKING
Contact Us: Contact
The HFT_FIX can be run free for 2 weeks on any broker with a ECN. Apply for a free trial
Join Our Telegram Group
")


