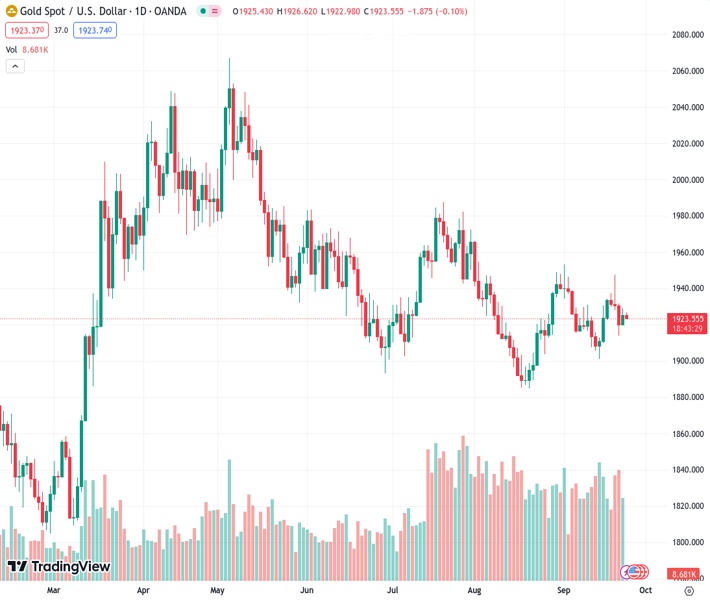
Gold price remains stable above $1,920 as a result of the weakened US Dollar (USD).
…
This is a premium post.
[s2If !current_user_can(access_s2member_level4)]Please register for FREE REGISTER to read full post below containing analysis. In case of any error or you think you are not able to read the full post below, please email us at support#nehcap.com [lwa][/s2If] [s2If current_user_can(access_s2member_level1)]
- Gold price holds ground above $1,920 due to soft US Dollar (USD).
The pair currently trades last at 1923.10.
The previous day high was 1929.16 while the previous day low was 1919.52. The daily 38.2% Fib levels comes at 1925.48, expected to provide resistance. Similarly, the daily 61.8% fib level is at 1923.2, expected to provide resistance.
Gold price hovers above $1,920 during the Asian session on Monday. The prices of yellow metal snapped a losing streak on Friday as the US Dollar (USD) trimmed its intraday gains, which could be attributed to the falling in the US Treasury yields.
However, US bond yields have rebounded, with the yield on the 10-year US Treasury note appreciating to 4.45%, a 0.50% increase by the press time.
Regarding the recent data from S&P Global, business activity in the United States (US) remained nearly unchanged in September. The S&P Global Manufacturing PMI improved to 48.9 from 47.9 the previous month, surpassing expecting a reading of 48.0.
However, the Services PMI declined to 50.2 from 50.5 in July, falling short of the anticipated reading of 50.6. The Composite reading, offering an overall view of business activity, was in line with estimates at 50.1 but slightly lower than August’s 50.2 level.
US Dollar Index (DXY), measuring the Greenback’s value against six major currencies, is struggling to gain momentum, hovering around 105.60 at the time of writing.
Furthermore, Boston Fed President Susan Collins has suggested that further tightening is possible but emphasized the need for patience. Additionally, US Federal Reserve (Fed) Governor Michelle W. Bowman echoed similar sentiments, asserting that more rate hikes are necessary to control inflation.
The rising interest rates increase the opportunity cost of investing in non-yielding assets, which implies a negative outlook for precious metals like Gold.
The Fed has emphasized the importance of maintaining higher interest rates for an extended period to bring inflation back to its 2% target. This stance has raised market expectations for at least one more 25-basis-point rate hike by the end of the year.
Additionally, the Fed’s “dot plot” now indicates only two rate hikes in 2024, down from the previous projection of four rate hikes.
In the upcoming week, the US economic calendar will include key data releases such as Consumer Confidence, Durable Goods Orders, Initial Jobless Claims, and the Core PCE, the Fed’s preferred measure of inflation.
The annual figure for Core PCE is expected to drop from 4.2% to 3.9%. These figures could provide further direction for Gold prices.
Technical Levels: Supports and Resistances
XAUUSD currently trading at 1923.06 at the time of writing. Pair opened at 1925.26 and is trading with a change of -0.11 % .
| Overview | Overview.1 | |
|---|---|---|
| 0 | Today last price | 1923.06 |
| 1 | Today Daily Change | -2.20 |
| 2 | Today Daily Change % | -0.11 |
| 3 | Today daily open | 1925.26 |
The pair remains strongly bearish on the daily time frame. It trades below the 20 SMA @ 1925.97, 50 SMA 1930.03, 100 SMA @ 1942.27 and 200 SMA @ 1925.57.
| Trends | Trends.1 | |
|---|---|---|
| 0 | Daily SMA20 | 1925.97 |
| 1 | Daily SMA50 | 1930.03 |
| 2 | Daily SMA100 | 1942.27 |
| 3 | Daily SMA200 | 1925.57 |
The previous day high was 1929.16 while the previous day low was 1919.52. The daily 38.2% Fib levels comes at 1925.48, expected to provide resistance. Similarly, the daily 61.8% fib level is at 1923.2, expected to provide resistance.
Note the levels of interest below:
- Pivot support is noted at 1920.13, 1915.01, 1910.49
- Pivot resistance is noted at 1929.77, 1934.29, 1939.41
| Levels | Levels.1 |
|---|---|
| Previous Daily High | 1929.16 |
| Previous Daily Low | 1919.52 |
| Previous Weekly High | 1947.47 |
| Previous Weekly Low | 1913.95 |
| Previous Monthly High | 1966.08 |
| Previous Monthly Low | 1884.85 |
| Daily Fibonacci 38.2% | 1925.48 |
| Daily Fibonacci 61.8% | 1923.20 |
| Daily Pivot Point S1 | 1920.13 |
| Daily Pivot Point S2 | 1915.01 |
| Daily Pivot Point S3 | 1910.49 |
| Daily Pivot Point R1 | 1929.77 |
| Daily Pivot Point R2 | 1934.29 |
| Daily Pivot Point R3 | 1939.41 |
[/s2If]
Download Nehcap EAWe have two EAs that are operational on our LIVE accounts.
- EA-FIX: Check out the details here. Download EA-FIX . EA-FIX is a non-grid HFT scalper.
- EA-GROWTH: High quality low dd EA using trend grids. Download EA_GROWTHJoin Our Telegram Group
")


