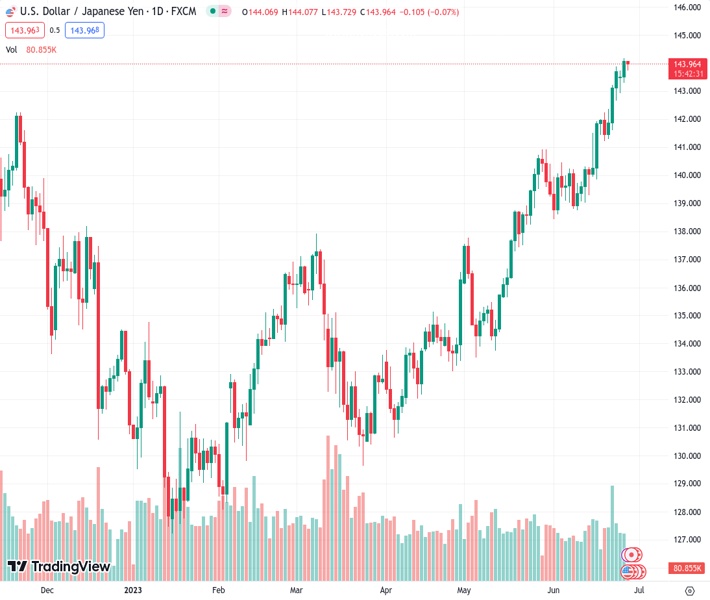
The USDJPY currency pair, currently trading at a rate of 143.981, is facing challenges in maintaining its upward momentum at its highest level of the year. According to analyst @nehcap, a decline in value is anticipated in the near future.
…
This is a premium post.
[s2If !current_user_can(access_s2member_level4)]Please register for FREE REGISTER to read full post below containing analysis. In case of any error or you think you are not able to read the full post below, please email us at support#nehcap.com [lwa][/s2If] [s2If current_user_can(access_s2member_level1)]
- USD/JPY struggles to defend upside momentum at yearly top.
The pair currently trades last at 143.981.
The previous day high was 144.18 while the previous day low was 143.28. The daily 38.2% Fib levels comes at 143.83, expected to provide support. Similarly, the daily 61.8% fib level is at 143.62, expected to provide support.
USD/JPY buyers lack upside momentum during early Wednesday as the Yen pair seesaws near 144.00, printing mild losses heading into the European session.
The quote’s latest performance appears interesting as it stays within the weekly rising wedge bearish chart formation while making rounds to the highest levels since November 2022.
That said, the bearish MACD signals, steady RSI (14) line and chatters about the Japanese government’s market intervention also seem to challenge the USD/JPY buyers of late.
On the same line is the cautious mood ahead of Bank of Japan (BoJ) Governor Kazuo Ueda’s speech at the European Central Bank (ECB) Forum in Sintra.
With this, the USD/JPY sellers remain hopeful of consolidating the biggest monthly gains since February.
However, a clear downside break of the 143.50 support becomes necessary to confirm the bearish chart formation suggesting a theoretical target of 145.70.
Even so, the 100-Hour Moving Average (HMA) and the one-week-old rising support line, respectively near 143.30 and 142.80 act as additional downside filters to challenge the USD/JPY bears.
Meanwhile, the stated wedge’s top line of near 144.20 guards the USD/JPY pair’s immediate upside ahead of the October 2022 low of 145.10. Following that, the theoretical target of 145.70 and the 146.00 round figure may lure the pair buyers.
Trend: Pullback expected
Technical Levels: Supports and Resistances
USDJPY currently trading at 143.98 at the time of writing. Pair opened at 144.08 and is trading with a change of -0.07% % .
| Overview | Overview.1 | |
|---|---|---|
| 0 | Today last price | 143.98 |
| 1 | Today Daily Change | -0.10 |
| 2 | Today Daily Change % | -0.07% |
| 3 | Today daily open | 144.08 |
The pair remains strongly bullish on the daily timeframe. It trades above its 20 SMA @ 140.88, 50 SMA 138.19, 100 SMA @ 135.88 and 200 SMA @ 137.22.
| Trends | Trends.1 | |
|---|---|---|
| 0 | Daily SMA20 | 140.88 |
| 1 | Daily SMA50 | 138.19 |
| 2 | Daily SMA100 | 135.88 |
| 3 | Daily SMA200 | 137.22 |
The previous day high was 144.18 while the previous day low was 143.28. The daily 38.2% Fib levels comes at 143.83, expected to provide support. Similarly, the daily 61.8% fib level is at 143.62, expected to provide support.
Note the levels of interest below:
- Pivot support is noted at 143.51, 142.95, 142.62
- Pivot resistance is noted at 144.41, 144.74, 145.3
| Levels | Levels.1 |
|---|---|
| Previous Daily High | 144.18 |
| Previous Daily Low | 143.28 |
| Previous Weekly High | 143.87 |
| Previous Weekly Low | 141.21 |
| Previous Monthly High | 140.93 |
| Previous Monthly Low | 133.50 |
| Daily Fibonacci 38.2% | 143.83 |
| Daily Fibonacci 61.8% | 143.62 |
| Daily Pivot Point S1 | 143.51 |
| Daily Pivot Point S2 | 142.95 |
| Daily Pivot Point S3 | 142.62 |
| Daily Pivot Point R1 | 144.41 |
| Daily Pivot Point R2 | 144.74 |
| Daily Pivot Point R3 | 145.30 |
[/s2If]
Nehcap Expert Advisor
The NEHCAP MT4 EA is high quality professional trading system geared to generate returns without using GRID or martingales. Each trade has strict risk per trade parameter. The pairs under management include EURUSD, GBPUSD, AUDCAD, AUDNZD,GBPAUD, EURAUD, EURCAD, CHFJPY and many more.
The system is trading live: LIVE ACCOUNT TRACKING
You can run it free. Apply for a free trial and track our account. Buy the system or use profit share mechanism to generate returns on your MT4.
Join Our Telegram Group
")


