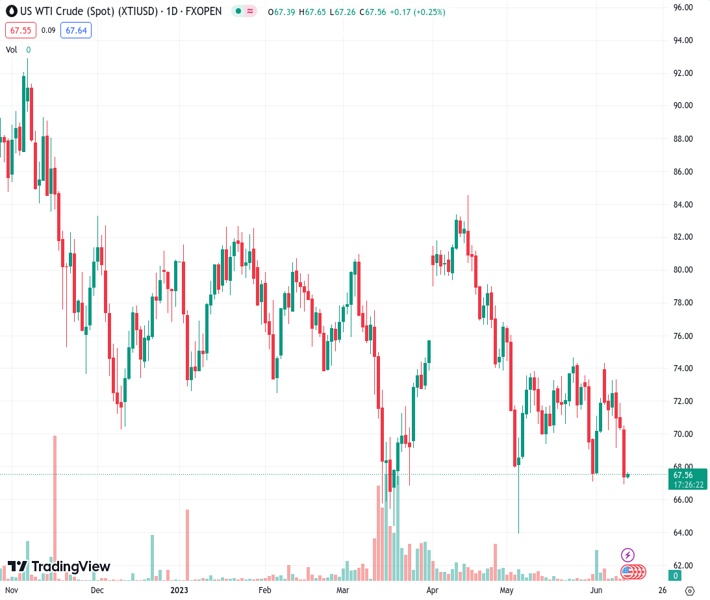
WTI is currently stabilizing after experiencing a decline overnight, reaching the lowest point it has been since the beginning of May.
…
This is a premium post.
[s2If !current_user_can(access_s2member_level4)]Please register for FREE REGISTER to read full post below containing analysis. In case of any error or you think you are not able to read the full post below, please email us at support#nehcap.com [lwa][/s2If] [s2If current_user_can(access_s2member_level1)]
- WTI consolidates the overnight slump to the lowest level since early May.
The pair currently trades last at 67.44.
The previous day high was 70.58 while the previous day low was 66.95. The daily 38.2% Fib levels comes at 68.34, expected to provide resistance. Similarly, the daily 61.8% fib level is at 69.19, expected to provide resistance.
Western Texas Intermediate (WTI) Crude Oil prices enter a bearish consolidation phase during the Asian session on Tuesday and oscillate in a narrow band near the lowest level since early May touched the previous day. The commodity remains on the defensive for the fourth straight day and currently trades just below the mid-$67.00s, down less than 0.20% for the day.
Investors remain worried that a global economic slowdown, particularly in China, will dent fuel demand. Moreover, the
Organization of Petroleum Exporting Countries (OPEC) and the International Energy Agency (IEA) are expected to cut demand forecasts in their respective market updates on Tuesday. This continues to weigh on Crude Oil prices ahead of the crucial US CPI report, which might influence the Fed’s policy outlook and drive the US Dollar (USD) price dynamics.
From a technical perspective, a sustained break and acceptance below the $67.00 mark will confirm a fresh bearish breakdown for Crude Oil prices. The black liquid might then accelerate the slide towards the $66.55 intermediate support before eventually dropping to the $66.00 round figure. The downward trajectory could get extended further towards sub-$66.00 levels en route to the $65.45 area, the $65.00 psychological mark and the $64.40-$64.30 region, or the YTD low touched in May.
On the flip side, any attempted recovery might now confront some resistance near the $68.00 round figure, above which a bout of a short-covering has the potential to lift Crude Oil prices to the $68.50-$68.55 resistance zone. Some follow-through buying could pave the way for an additional recovery towards the $69.00 mark. The black liquid could eventually climb further beyond the $69.40-$69.45 region, towards reclaiming the $70.00 psychological mark.
Technical Levels: Supports and Resistances
XTIUSD currently trading at 67.44 at the time of writing. Pair opened at 67.48 and is trading with a change of -0.06 % .
| Overview | Overview.1 | |
|---|---|---|
| 0 | Today last price | 67.44 |
| 1 | Today Daily Change | -0.04 |
| 2 | Today Daily Change % | -0.06 |
| 3 | Today daily open | 67.48 |
The pair remains strongly bearish on the daily time frame. It trades below the 20 SMA @ 71.46, 50 SMA 74.5, 100 SMA @ 75.14 and 200 SMA @ 78.48.
| Trends | Trends.1 | |
|---|---|---|
| 0 | Daily SMA20 | 71.46 |
| 1 | Daily SMA50 | 74.50 |
| 2 | Daily SMA100 | 75.14 |
| 3 | Daily SMA200 | 78.48 |
The previous day high was 70.58 while the previous day low was 66.95. The daily 38.2% Fib levels comes at 68.34, expected to provide resistance. Similarly, the daily 61.8% fib level is at 69.19, expected to provide resistance.
Note the levels of interest below:
- Pivot support is noted at 66.1, 64.71, 62.47
- Pivot resistance is noted at 69.72, 71.96, 73.34
| Levels | Levels.1 |
|---|---|
| Previous Daily High | 70.58 |
| Previous Daily Low | 66.95 |
| Previous Weekly High | 74.36 |
| Previous Weekly Low | 69.17 |
| Previous Monthly High | 76.61 |
| Previous Monthly Low | 64.31 |
| Daily Fibonacci 38.2% | 68.34 |
| Daily Fibonacci 61.8% | 69.19 |
| Daily Pivot Point S1 | 66.10 |
| Daily Pivot Point S2 | 64.71 |
| Daily Pivot Point S3 | 62.47 |
| Daily Pivot Point R1 | 69.72 |
| Daily Pivot Point R2 | 71.96 |
| Daily Pivot Point R3 | 73.34 |
[/s2If]
Nehcap Expert Advisor
The NEHCAP MT4 EA is high quality professional trading system geared to generate returns without using GRID or martingales. Each trade has strict risk per trade parameter. The pairs under management include EURUSD, GBPUSD, AUDCAD, AUDNZD,GBPAUD, EURAUD, EURCAD, CHFJPY and many more.
The system is trading live: LIVE ACCOUNT TRACKING
You can run it free. Apply for a free trial and track our account. Buy the system or use profit share mechanism to generate returns on your MT4.
Join Our Telegram Group
")


