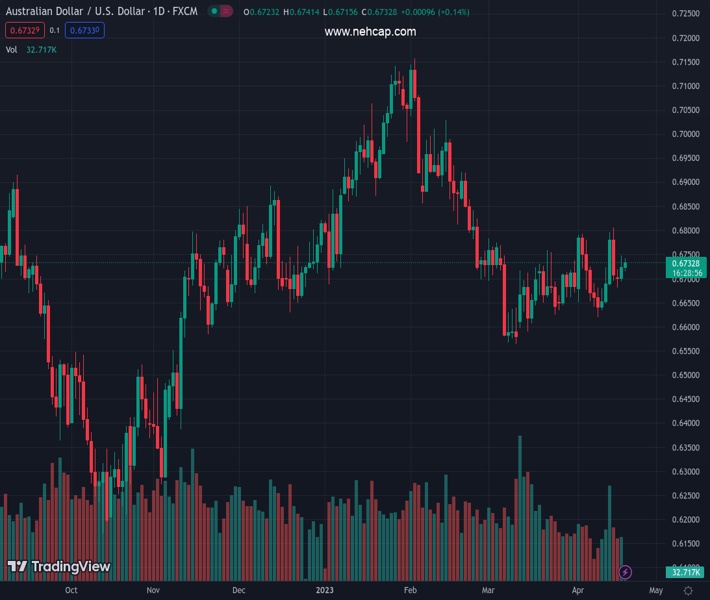
#AUDUSD @ 0.67324 lack follow-through while keeping the previous day’s recovery moves. (Pivot Orderbook analysis)
…
This is a premium post.
[s2If !current_user_can(access_s2member_level4)]Please register for PREMIUM VERSION HERE to read full post below containing analysis. In case of any error or you think you are not able to read the full post below, please email us at support#nehcap.com [lwa][/s2If] [s2If current_user_can(access_s2member_level4)]
- AUD/USD lack follow-through while keeping the previous day’s recovery moves.
- Australia’s Westpac Leading Index improved to -0.01% in March.
- Challenges to sentiment from China, hawkish Fed bets and contrast with downbeat US data to check Aussie pair traders.
- Fed’s Beige Book, risk catalysts will be important for fresh impulse amid a light calendar.
The pair currently trades last at 0.67324.
The previous day high was 0.6748 while the previous day low was 0.6692. The daily 38.2% Fib levels comes at 0.6726, expected to provide support. Similarly, the daily 61.8% fib level is at 0.6714, expected to provide support.
AUD/USD picks up bids to print mild gains around 0.6730 heading into Wednesday’s European session. Even so, the Aussie pair struggles to extend the previous day’s recovery as challenges to sentiment and hawkish Fed talks contrast with the downbeat US data and firmer Aussie statistics during sluggish hours of trading.
That said, Australia’s Westpac Leading Index rose to -0.01% in March versus -0.06% prior The same justifies the economic optimism showed during the previous day’s Reserve Bank of Australia (RBA) Monetary Policy Meeting Minutes. Also positive for the Aussie pair is the downbeat stream of US housing numbers, published on Tuesday.
However, the recent geopolitical fears emanating from China and Russia, as well as the hawkish Federal Reserve (Fed) bias ahead of the blackout period, starting from Saturday, prod the AUD/USD buyers.
That said, US stock futures are mildly offered and the equities in the Asia-Pacific region also grind lower amid fears surrounding the US-China tension about Taiwan, due to the US House China Committee’s discussion about the Taiwan invasion scenario. On the same line could be the likely drag on the US debt ceiling decision due to US President Joe Biden’s hesitance in lifting limits. Additionally, Bloomberg released news suggesting China’s role in the Russia-Ukraine war, which in turn adds strength to the risk-off mood and allows the US Dollar bears to take a breather.
It’s worth noting that the markets are almost certain of 0.25% Fed rate hike in May and the same joins the recently easing odds favoring the rate cut in 2023 to portray the hawkish bias about the US central bank. Behind the moves are Friday’s US Consumer-centric figures and Monday’s US activity data, as well as the latest upbeat comments from St. Louis Federal Reserve President James Bullard, Richmond Fed President Thomas Barkin and Atlanta Fed President Raphael W. Bostic.
On the contrary, upbeat China GDP, Retail Sales and Industrial Production data join the International Monetary Fund’s (IMF) optimism about the dragon nation to propel the AUD/USD prices.
Moving on, AUD/USD may remain lackluster amid a light calendar ahead of the monthly release of the Fed Beige Book.
Although Monday’s Doji candlestick joins bullish MACD signals and firmer RSI signals to keep AUD/USD buyers, the 200-DMA hurdle of around 0.6745, followed by a seven-week-old rising trend line near 0.6800, restrict the Aussie pair’s further upside.
Technical Levels: Supports and Resistances
AUDUSD currently trading at 0.6733 at the time of writing. Pair opened at 0.6724 and is trading with a change of 0.13% % .
| Overview | Overview.1 | |
|---|---|---|
| 0 | Today last price | 0.6733 |
| 1 | Today Daily Change | 0.0009 |
| 2 | Today Daily Change % | 0.13% |
| 3 | Today daily open | 0.6724 |
The pair is trading above its 20 Daily moving average @ 0.6698, below its 50 Daily moving average @ 0.674 , below its 100 Daily moving average @ 0.6801 and below its 200 Daily moving average @ 0.6744
| Trends | Trends.1 | |
|---|---|---|
| 0 | Daily SMA20 | 0.6698 |
| 1 | Daily SMA50 | 0.6740 |
| 2 | Daily SMA100 | 0.6801 |
| 3 | Daily SMA200 | 0.6744 |
The previous day high was 0.6748 while the previous day low was 0.6692. The daily 38.2% Fib levels comes at 0.6726, expected to provide support. Similarly, the daily 61.8% fib level is at 0.6714, expected to provide support.
Note the levels of interest below:
- Pivot support is noted at 0.6695, 0.6666, 0.664
- Pivot resistance is noted at 0.675, 0.6776, 0.6805
| Levels | Levels.1 |
|---|---|
| Previous Daily High | 0.6748 |
| Previous Daily Low | 0.6692 |
| Previous Weekly High | 0.6806 |
| Previous Weekly Low | 0.6620 |
| Previous Monthly High | 0.6784 |
| Previous Monthly Low | 0.6564 |
| Daily Fibonacci 38.2% | 0.6726 |
| Daily Fibonacci 61.8% | 0.6714 |
| Daily Pivot Point S1 | 0.6695 |
| Daily Pivot Point S2 | 0.6666 |
| Daily Pivot Point S3 | 0.6640 |
| Daily Pivot Point R1 | 0.6750 |
| Daily Pivot Point R2 | 0.6776 |
| Daily Pivot Point R3 | 0.6805 |
[/s2If]
Join Our Telegram Group
")


