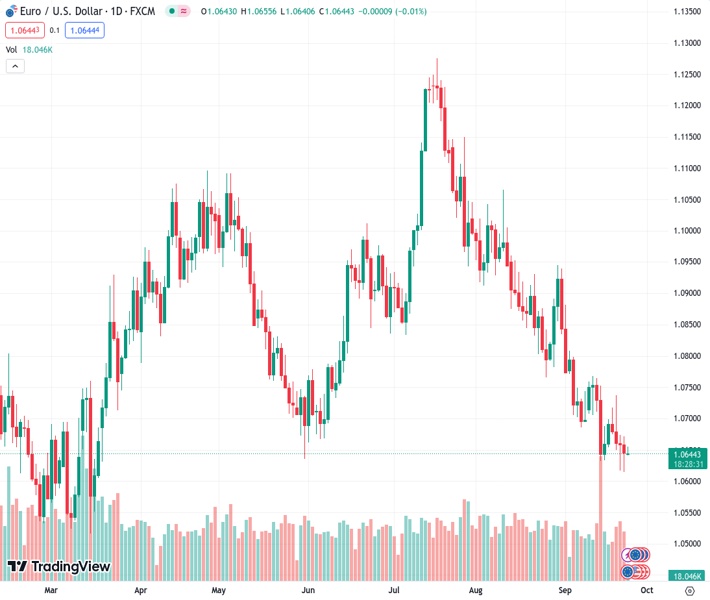
The EURUSD currency pair, currently trading at 1.06446, is stabilizing after experiencing recent declines. This level is the lowest it has reached since it was last observed in March.
…
This is a premium post.
[s2If !current_user_can(access_s2member_level4)]Please register for FREE REGISTER to read full post below containing analysis. In case of any error or you think you are not able to read the full post below, please email us at support#nehcap.com [lwa][/s2If] [s2If current_user_can(access_s2member_level1)]
- EUR/USD consolidates its recent losses to the lowest level since March touched last week.
The pair currently trades last at 1.06446.
The previous day high was 1.0672 while the previous day low was 1.0615. The daily 38.2% Fib levels comes at 1.0637, expected to provide support. Similarly, the daily 61.8% fib level is at 1.065, expected to provide resistance.
The EUR/USD pair kicks off the new week on a subdued note and oscillates in a narrow trading band, around mid-1.0600s through the Asian session. Spot prices, meanwhile, remain well within the striking distance of the lowest level since March touched last Friday and seem vulnerable to prolonging the downward trajectory witnessed over the past two months or so.
The US Dollar (USD) stands tall near a more than six-month peak and remains well supported by elevated US Treasury bond yields, bolstered by the Federal Reserve’s (Fed) hawkish outlook and the reduction in the expected number of rate cuts in 2024. The shared currency, on the other hand, is undermined by the European Central Bank’s (ECB) dovish rate decision last Thursday, which further contributes to keeping a lid on the EUR/USD pair.
From a technical perspective, the negative outlook is reinforced by the fact that the downfall from the 1.1275 area, or a 17-month peak touched in July, has been along a downward sloping channel. This points to a well-established bearish trend and suggests that the path of least resistance for the EUR/USD pair is to the downside. Moreover, oscillators on the daily chart are holding deep in the negative territory and are still away from being in the oversold zone.
Hence, a subsequent slide towards the 1.0600 round figure, en route to the ascending channel support, currently pegged near the 1.0560-1.0555 region, looks like a distinct possibility. Some follow-through selling will mark a fresh bearish breakdown and set the stage for an extension of the EUR/USD pair’s over a two-month-old downtrend.
On the flip side, any recovery beyond the 1.0670 area is likely to confront stiff resistance near the 1.0700 mark. This is followed by last week’s swing high, around the 1.0735 region, which if cleared decisively could lift the EUR/USD pair towards challenging the 1.0780 hurdle, representing the top boundary of the aforementioned channel. A convincing breakout, leading to a subsequent move beyond the 1.0800 round figure, will suggest that spot prices have formed a near-term bottom and pave the way for some meaningful near-term appreciating move.
Technical Levels: Supports and Resistances
EURUSD currently trading at 1.0646 at the time of writing. Pair opened at 1.0648 and is trading with a change of -0.02 % .
| Overview | Overview.1 | |
|---|---|---|
| 0 | Today last price | 1.0646 |
| 1 | Today Daily Change | -0.0002 |
| 2 | Today Daily Change % | -0.0200 |
| 3 | Today daily open | 1.0648 |
The pair remains strongly bearish on the daily time frame. It trades below the 20 SMA @ 1.0738, 50 SMA 1.0885, 100 SMA @ 1.0877 and 200 SMA @ 1.083.
| Trends | Trends.1 | |
|---|---|---|
| 0 | Daily SMA20 | 1.0738 |
| 1 | Daily SMA50 | 1.0885 |
| 2 | Daily SMA100 | 1.0877 |
| 3 | Daily SMA200 | 1.0830 |
The previous day high was 1.0672 while the previous day low was 1.0615. The daily 38.2% Fib levels comes at 1.0637, expected to provide support. Similarly, the daily 61.8% fib level is at 1.065, expected to provide resistance.
Note the levels of interest below:
- Pivot support is noted at 1.0618, 1.0588, 1.0562
- Pivot resistance is noted at 1.0675, 1.0702, 1.0731
| Levels | Levels.1 |
|---|---|
| Previous Daily High | 1.0672 |
| Previous Daily Low | 1.0615 |
| Previous Weekly High | 1.0737 |
| Previous Weekly Low | 1.0615 |
| Previous Monthly High | 1.1065 |
| Previous Monthly Low | 1.0766 |
| Daily Fibonacci 38.2% | 1.0637 |
| Daily Fibonacci 61.8% | 1.0650 |
| Daily Pivot Point S1 | 1.0618 |
| Daily Pivot Point S2 | 1.0588 |
| Daily Pivot Point S3 | 1.0562 |
| Daily Pivot Point R1 | 1.0675 |
| Daily Pivot Point R2 | 1.0702 |
| Daily Pivot Point R3 | 1.0731 |
[/s2If]
Download Nehcap EAWe have two EAs that are operational on our LIVE accounts.
- EA-FIX: Check out the details here. Download EA-FIX . EA-FIX is a non-grid HFT scalper.
- EA-GROWTH: High quality low dd EA using trend grids. Download EA_GROWTHJoin Our Telegram Group
")


