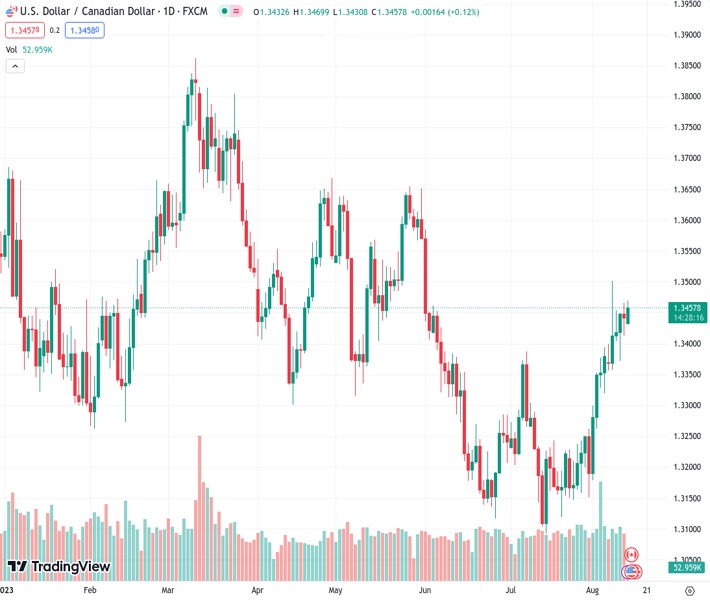
The USDCAD at a rate of 1.34572 is increasing its strength and continues to trade positively for the fifth week in a row on Monday.
…
This is a premium post.
[s2If !current_user_can(access_s2member_level4)]Please register for FREE REGISTER to read full post below containing analysis. In case of any error or you think you are not able to read the full post below, please email us at support#nehcap.com [lwa][/s2If] [s2If current_user_can(access_s2member_level1)]
- USD/CAD gains momentum, trades on a positive note for the fifth consecutive week on Monday.
The pair currently trades last at 1.34572.
The previous day high was 1.3466 while the previous day low was 1.3412. The daily 38.2% Fib levels comes at 1.3433, expected to provide support. Similarly, the daily 61.8% fib level is at 1.3446, expected to provide support.
The USD/CAD pair trades in positive territory in the Asian trading hours on Monday. The uptick in the pair is bolstered by mixed US economic data and the rise in US 10-year Treasury bond yields. Meanwhile, the uptick in oil prices supports the Loonie against the US Dollar. The major pair currently trades near 1.3457, gaining 11% for the day. Market participants will keep an eye on the Canadian Consumer Price Index (CPI) YoY for July on Tuesday. The figure is expected to rise from 2.8% to 3.0% on a yearly basis.
From the technical perspective, USD/CAD holds above the 50- and 100-hour Exponential Moving Averages (EMA), which means further upside looks favourable.
Any follow-through buying beyond 1.3470 (the upper boundary of the Bollinger Band) could pave the way to 1.3500, highlighting a psychological round figure and a high of August 8. Any meaningful follow-through buying above the latter will see a rally to the next barrier at 1.3550 (high of May 23), en route to 1.3650 (high of May 31).
On the flip side, 1.3430 (the midline of the Bollinger Band) acts as an initial support level for USD/CAD. The 1.3390–1.3400 zone will be the key contention level to watch. The mentioned level is the confluence of the lower limit of the Bollinger Band, a psychological round mark, and the 50-hour EMA. Any extended weakness below the latter will challenge the next downside filter at 1.3340 (the 100-hour EMA). The additional downside filter is located at 1.3300 (high of August 1, a psychological figure).
However, the further upside appears favourable as the Relative Strength Index (RSI) stands above 50, activating the bullish momentum for the USD/CAD pair for the time being.
Technical Levels: Supports and Resistances
USDCAD currently trading at 1.3458 at the time of writing. Pair opened at 1.3442 and is trading with a change of 0.12 % .
| Overview | Overview.1 | |
|---|---|---|
| 0 | Today last price | 1.3458 |
| 1 | Today Daily Change | 0.0016 |
| 2 | Today Daily Change % | 0.1200 |
| 3 | Today daily open | 1.3442 |
The pair remains strongly bullish on the daily timeframe. It trades above its 20 SMA @ 1.328, 50 SMA 1.3268, 100 SMA @ 1.3388 and 200 SMA @ 1.345.
| Trends | Trends.1 | |
|---|---|---|
| 0 | Daily SMA20 | 1.3280 |
| 1 | Daily SMA50 | 1.3268 |
| 2 | Daily SMA100 | 1.3388 |
| 3 | Daily SMA200 | 1.3450 |
The previous day high was 1.3466 while the previous day low was 1.3412. The daily 38.2% Fib levels comes at 1.3433, expected to provide support. Similarly, the daily 61.8% fib level is at 1.3446, expected to provide support.
Note the levels of interest below:
- Pivot support is noted at 1.3415, 1.3387, 1.3361
- Pivot resistance is noted at 1.3468, 1.3494, 1.3522
| Levels | Levels.1 |
|---|---|
| Previous Daily High | 1.3466 |
| Previous Daily Low | 1.3412 |
| Previous Weekly High | 1.3502 |
| Previous Weekly Low | 1.3356 |
| Previous Monthly High | 1.3387 |
| Previous Monthly Low | 1.3093 |
| Daily Fibonacci 38.2% | 1.3433 |
| Daily Fibonacci 61.8% | 1.3446 |
| Daily Pivot Point S1 | 1.3415 |
| Daily Pivot Point S2 | 1.3387 |
| Daily Pivot Point S3 | 1.3361 |
| Daily Pivot Point R1 | 1.3468 |
| Daily Pivot Point R2 | 1.3494 |
| Daily Pivot Point R3 | 1.3522 |
[/s2If]
Download Nehcap EAWe have two EAs that are operational on our LIVE accounts.
- EA-FIX: Check out the details here. Download EA-FIX . EA-FIX is a non-grid HFT scalper.
- EA-GROWTH: High quality low dd EA using trend grids. Download EA_GROWTHJoin Our Telegram Group
")


