There has been a decline in the AUDUSD exchange rate at 0.67343 due to increased selling activity around 0.6750. This shift is a result of investors redirecting their attention to the policy decisions of the Federal Reserve.
…
This is a premium post.
[s2If !current_user_can(access_s2member_level4)]Please register for FREE REGISTER to read full post below containing analysis. In case of any error or you think you are not able to read the full post below, please email us at support#nehcap.com [lwa][/s2If] [s2If current_user_can(access_s2member_level1)]
- AUD/USD has sensed selling pressure around 0.6750 as investors have shifted their focus toward the Fed policy.
The pair currently trades last at 0.67343.
The previous day high was 0.6788 while the previous day low was 0.6722. The daily 38.2% Fib levels comes at 0.6747, expected to provide resistance. Similarly, the daily 61.8% fib level is at 0.6763, expected to provide resistance.
The AUD/USD pair has met stiff resistance near 0.6750 after a less-confident pullback in the late European session. The recovery move in the Aussie asset has faded as investors have turned cautious ahead of the interest rate policy by the Federal Reserve (Fed), which will be announced on July 26.
S&P500 futures have posted significant gains in the London session, portraying ease in the negative market sentiment. The US Dollar Index (DXY) is gathering strength to recapture the intraday high of 101.41 as investors are anticipating that the Fed will hike interest rates on July 26 after skipping in June.
Meanwhile, the Australian Dollar is expected to deliver a power-pack action ahead of the inflation data for the second quarter. As per the consensus, inflation gained at a pace of 1.0% vs. the prior pace of 1.4% on a quarterly basis. Annual Consumer Price Index (CPI) contracted to 6.2% against 7.0% the prior release.
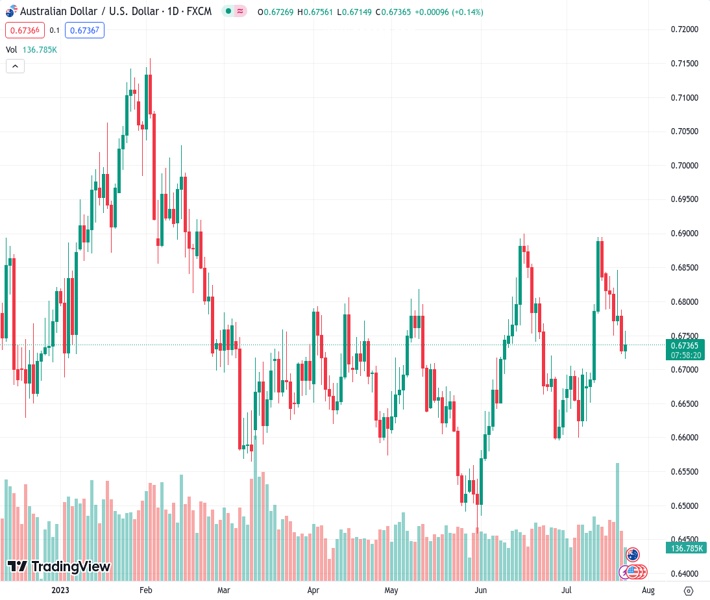
AUD/USD has sensed selling pressure while attempting to climb above the horizontal resistance plotted from June 16 high around 0.6900. The Aussie asset has formed a Double Top chart pattern, which indicates a bearish reversal. The 20-period Exponential Moving Average (EMA) at 0.6758 is acting as a barricade for the Aussie bulls.
The Relative Strength Index (RSI) (14) has slipped below 40.00, which indicates that the downside momentum has been activated.
Going forward, a downside move below the immediate support of 0.6700 would expose the asset toward July 11 low at 0.6650, followed by the round-level support at 0.6600.
On the flip side, a recovery move above July 20 high at 0.6847 would drive the asset toward June 16 high of around 0.6900. Breach of the latter would send the major toward February 16 high at 0.6936.
Technical Levels: Supports and Resistances
AUDUSD currently trading at 0.6736 at the time of writing. Pair opened at 0.6731 and is trading with a change of 0.07 % .
| Overview | Overview.1 | |
|---|---|---|
| 0 | Today last price | 0.6736 |
| 1 | Today Daily Change | 0.0005 |
| 2 | Today Daily Change % | 0.0700 |
| 3 | Today daily open | 0.6731 |
The pair remains strongly bullish on the daily timeframe. It trades above its 20 SMA @ 0.6718, 50 SMA 0.6691, 100 SMA @ 0.6687 and 200 SMA @ 0.6718.
| Trends | Trends.1 | |
|---|---|---|
| 0 | Daily SMA20 | 0.6718 |
| 1 | Daily SMA50 | 0.6691 |
| 2 | Daily SMA100 | 0.6687 |
| 3 | Daily SMA200 | 0.6718 |
The previous day high was 0.6788 while the previous day low was 0.6722. The daily 38.2% Fib levels comes at 0.6747, expected to provide resistance. Similarly, the daily 61.8% fib level is at 0.6763, expected to provide resistance.
Note the levels of interest below:
- Pivot support is noted at 0.6706, 0.6682, 0.6641
- Pivot resistance is noted at 0.6772, 0.6813, 0.6838
| Levels | Levels.1 |
|---|---|
| Previous Daily High | 0.6788 |
| Previous Daily Low | 0.6722 |
| Previous Weekly High | 0.6854 |
| Previous Weekly Low | 0.6722 |
| Previous Monthly High | 0.6900 |
| Previous Monthly Low | 0.6484 |
| Daily Fibonacci 38.2% | 0.6747 |
| Daily Fibonacci 61.8% | 0.6763 |
| Daily Pivot Point S1 | 0.6706 |
| Daily Pivot Point S2 | 0.6682 |
| Daily Pivot Point S3 | 0.6641 |
| Daily Pivot Point R1 | 0.6772 |
| Daily Pivot Point R2 | 0.6813 |
| Daily Pivot Point R3 | 0.6838 |
[/s2If]
Download Nehcap EAWe have two EAs that are operational on our LIVE accounts.
- EA-FIX: Check out the details here. Download EA-FIX . EA-FIX is a non-grid HFT scalper.
- EA-GROWTH: High quality low dd EA using trend grids. Download EA_GROWTHJoin Our Telegram Group
")


