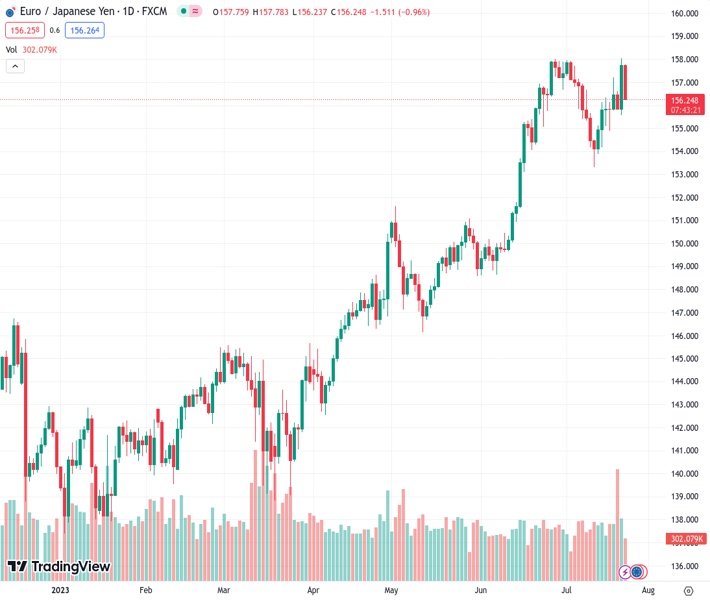
Pressure is being exerted on the EURJPY currency pair, which is currently trading at a rate of 156.257, as a result of the new highs reached on Friday.
…
This is a premium post.
[s2If !current_user_can(access_s2member_level4)]Please register for FREE REGISTER to read full post below containing analysis. In case of any error or you think you are not able to read the full post below, please email us at support#nehcap.com [lwa][/s2If] [s2If current_user_can(access_s2member_level1)]
- EUR/JPY comes under pressure following Friday’s new tops.
The pair currently trades last at 156.257.
The previous day high was 158.05 while the previous day low was 155.59. The daily 38.2% Fib levels comes at 157.11, expected to provide resistance. Similarly, the daily 61.8% fib level is at 156.53, expected to provide resistance.
EUR/JPY comes under some moderated downside pressure and retreats to the low-156.00s following Friday’s YTD tops just above 158.00 the figure.
In the meantime, the cross keeps the recovery mode well in place and the continuation of the uptrend is expected to challenge the key round level at 160.00 sooner rather than later.
So far, the longer term positive outlook for the cross appears favoured while above the 200-day SMA, today at 146.27.
Technical Levels: Supports and Resistances
EURJPY currently trading at 156.32 at the time of writing. Pair opened at 157.76 and is trading with a change of -0.91 % .
| Overview | Overview.1 | |
|---|---|---|
| 0 | Today last price | 156.32 |
| 1 | Today Daily Change | 152.00 |
| 2 | Today Daily Change % | -0.91 |
| 3 | Today daily open | 157.76 |
The pair is trading below its 20 Daily moving average @ 156.42, above its 50 Daily moving average @ 153.2 , above its 100 Daily moving average @ 149.3 and above its 200 Daily moving average @ 146.26
| Trends | Trends.1 | |
|---|---|---|
| 0 | Daily SMA20 | 156.42 |
| 1 | Daily SMA50 | 153.20 |
| 2 | Daily SMA100 | 149.30 |
| 3 | Daily SMA200 | 146.26 |
The previous day high was 158.05 while the previous day low was 155.59. The daily 38.2% Fib levels comes at 157.11, expected to provide resistance. Similarly, the daily 61.8% fib level is at 156.53, expected to provide resistance.
Note the levels of interest below:
- Pivot support is noted at 156.22, 154.67, 153.76
- Pivot resistance is noted at 158.68, 159.6, 161.14
| Levels | Levels.1 |
|---|---|
| Previous Daily High | 158.05 |
| Previous Daily Low | 155.59 |
| Previous Weekly High | 158.05 |
| Previous Weekly Low | 154.88 |
| Previous Monthly High | 158.00 |
| Previous Monthly Low | 148.62 |
| Daily Fibonacci 38.2% | 157.11 |
| Daily Fibonacci 61.8% | 156.53 |
| Daily Pivot Point S1 | 156.22 |
| Daily Pivot Point S2 | 154.67 |
| Daily Pivot Point S3 | 153.76 |
| Daily Pivot Point R1 | 158.68 |
| Daily Pivot Point R2 | 159.60 |
| Daily Pivot Point R3 | 161.14 |
[/s2If]
Download Nehcap EAWe have two EAs that are operational on our LIVE accounts.
- EA-FIX: Check out the details here. Download EA-FIX . EA-FIX is a non-grid HFT scalper.
- EA-GROWTH: High quality low dd EA using trend grids. Download EA_GROWTHJoin Our Telegram Group
")


