On Tuesday, there is a renewed interest in buying the EURUSD currency pair at a rate of 1.09266, and this is assisted by a small decrease in the strength of the US dollar.
…
This is a premium post.
[s2If !current_user_can(access_s2member_level4)]Please register for FREE REGISTER to read full post below containing analysis. In case of any error or you think you are not able to read the full post below, please email us at support#nehcap.com [lwa][/s2If] [s2If current_user_can(access_s2member_level1)]
- EUR/USD attracts fresh buying on Tuesday and draws support from a modest USD weakness.
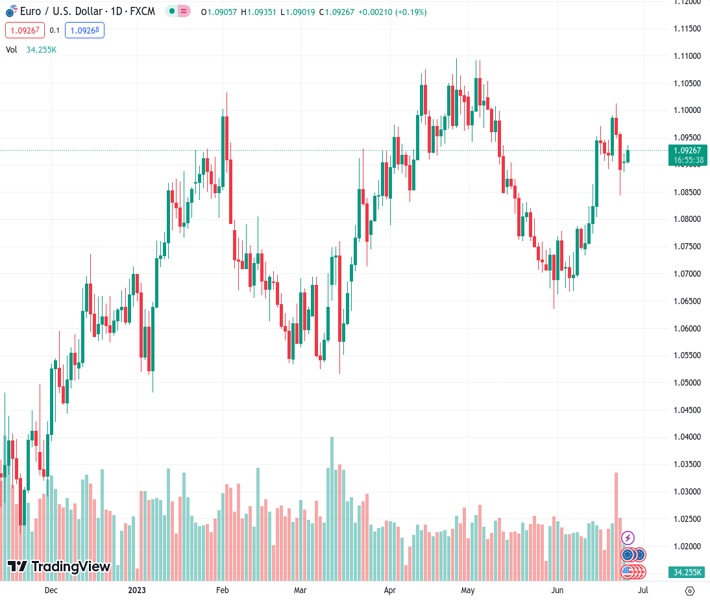
The pair currently trades last at 1.09266.
The previous day high was 1.092 while the previous day low was 1.0887. The daily 38.2% Fib levels comes at 1.0908, expected to provide support. Similarly, the daily 61.8% fib level is at 1.09, expected to provide support.
The EUR/USD pair regains some positive traction following the previous day’s directionless price moves and spikes to a three-day peak, around the 1.0935 area during the Asian session on Tuesday. Spot prices, however, struggle to capitalize on the move beyond the 100-hour Simple Moving Average (SMA) and retreat a few pips in the last hour.
The US Dollar (USD) remains on the defensive for the second successive day and turns out to be a key factor acting as a tailwind for the EUR/USD pair. That said, the Federal Reserve’s (Fed) hawkish outlook helps limit the downside for the USD and caps the upside for the major. Traders also seem reluctant to place aggressive bets around the shared currency in the wake of worries about economic headwinds stemming from rapidly rising borrowing costs. The fears were fueled by the disappointing release of flash Eurozone PMIs on Friday, which now leaves the European Central Bank (ECB) in a policy dilemma.
From a technical perspective, the 100-hour SMA coincides with the 50% Fibonacci retracement level of the recent corrective decline from the monthly peak touched last week. This makes it prudent to wait for sustained strength and acceptance above the 1.0930-1.0935 confluence before positioning for any further gains. With oscillators on the daily chart holding comfortably in the positive territory, the EUR/USD pair might then climb back to the 1.1000 psychological mark. Some follow-through buying has the potential to lift spot prices towards the next relevant hurdle near the 1.1080-1.1090 supply zone.
On the flip side, the 1.0900 mark now seems to protect the immediate downside ahead of the 23.6% Fibo. level, around the 1.0880 region. This is followed by last week’s swing low, around the 1.0845 zone. A convincing break below the latter might prompt some technical selling and accelerate the fall towards 100-day SMA, currently around the 1.0810-1.0800 area. Failure to defend the said support levels will shift the bias in favour of bearish traders and make the EUR/USD pair vulnerable to weaken further below the 1.0765-1.0760 intermediate support, towards challenging the 1.0700 round-figure mark.
Technical Levels: Supports and Resistances
EURUSD currently trading at 1.0923 at the time of writing. Pair opened at 1.0906 and is trading with a change of 0.16 % .
| Overview | Overview.1 | |
|---|---|---|
| 0 | Today last price | 1.0923 |
| 1 | Today Daily Change | 0.0017 |
| 2 | Today Daily Change % | 0.1600 |
| 3 | Today daily open | 1.0906 |
The pair remains strongly bullish on the daily timeframe. It trades above its 20 SMA @ 1.0819, 50 SMA 1.0876, 100 SMA @ 1.0811 and 200 SMA @ 1.0569.
| Trends | Trends.1 | |
|---|---|---|
| 0 | Daily SMA20 | 1.0819 |
| 1 | Daily SMA50 | 1.0876 |
| 2 | Daily SMA100 | 1.0811 |
| 3 | Daily SMA200 | 1.0569 |
The previous day high was 1.092 while the previous day low was 1.0887. The daily 38.2% Fib levels comes at 1.0908, expected to provide support. Similarly, the daily 61.8% fib level is at 1.09, expected to provide support.
Note the levels of interest below:
- Pivot support is noted at 1.0889, 1.0872, 1.0856
- Pivot resistance is noted at 1.0922, 1.0937, 1.0954
| Levels | Levels.1 |
|---|---|
| Previous Daily High | 1.0920 |
| Previous Daily Low | 1.0887 |
| Previous Weekly High | 1.1012 |
| Previous Weekly Low | 1.0844 |
| Previous Monthly High | 1.1092 |
| Previous Monthly Low | 1.0635 |
| Daily Fibonacci 38.2% | 1.0908 |
| Daily Fibonacci 61.8% | 1.0900 |
| Daily Pivot Point S1 | 1.0889 |
| Daily Pivot Point S2 | 1.0872 |
| Daily Pivot Point S3 | 1.0856 |
| Daily Pivot Point R1 | 1.0922 |
| Daily Pivot Point R2 | 1.0937 |
| Daily Pivot Point R3 | 1.0954 |
[/s2If]
Nehcap Expert Advisor
The NEHCAP MT4 EA is high quality professional trading system geared to generate returns without using GRID or martingales. Each trade has strict risk per trade parameter. The pairs under management include EURUSD, GBPUSD, AUDCAD, AUDNZD,GBPAUD, EURAUD, EURCAD, CHFJPY and many more.
The system is trading live: LIVE ACCOUNT TRACKING
You can run it free. Apply for a free trial and track our account. Buy the system or use profit share mechanism to generate returns on your MT4.
Join Our Telegram Group
")


