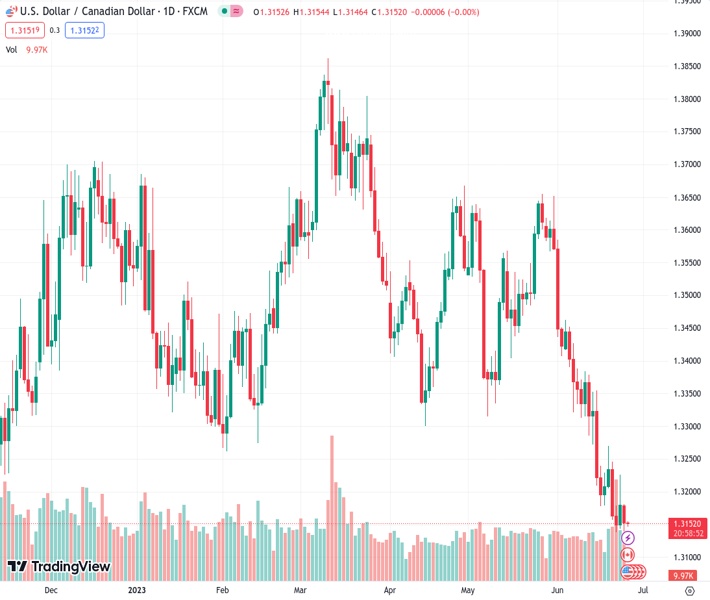
According to the @nehcap view, the USDCAD at 1.31502 is facing continued downward pressure and has reached its lowest point in nine months. However, there is an anticipated corrective rebound in the near future.
…
This is a premium post.
[s2If !current_user_can(access_s2member_level4)]Please register for FREE REGISTER to read full post below containing analysis. In case of any error or you think you are not able to read the full post below, please email us at support#nehcap.com [lwa][/s2If] [s2If current_user_can(access_s2member_level1)]
- USD/CAD remains pressured at the lowest levels in nine months.
The pair currently trades last at 1.31502.
The previous day high was 1.3226 while the previous day low was 1.3143. The daily 38.2% Fib levels comes at 1.3194, expected to provide resistance. Similarly, the daily 61.8% fib level is at 1.3175, expected to provide resistance.
USD/CAD fades bounces off the lowest levels since September 2022 as it retreats to 1.3150 amid early hours of Tuesday. In doing so, the Loonie pair portrays the market’s optimism about the Canadian inflation data ahead of the release. That said, the quote refreshed a multi-month low the previous day before bouncing off 1.3136.
It should be noted the technical details aren’t supporting the bears as the bottom line of a one-week-old bullish descending triangle joins the sluggish MACD signals and the below 50.0 levels of the RSI (14) line suggest bottom-picking of the Loonie pair.
The same highlights a one-week-old horizontal resistance area surrounding 1.3180 as the immediate hurdle for the USD/CAD buyers to cross to convince markets.
Even so, a convergence of the 50-SMA and the aforementioned triangle’s top line, near 1.3205 at the latest, could challenge the bulls.
Following that, a downward-sloping resistance line from June 05, close to 1.3230, will act as the last defense of the USD/CAD bears.
Meanwhile, the recent lows marked around 1.3140-35, forming part of the previously stated triangle, limit the short-term downside of the Loonie pair.
Following that, tops marked during early May and July of 2022 highlight the 1.3085-80 support zone as an extra filter toward the south.
In a case where the USD/CAD pair remains bearish past 1.3080, the odds of witnessing a slump to the 1.3000 psychological magnet can’t be ruled out.
Trend: Corrective bounce expected
Technical Levels: Supports and Resistances
USDCAD currently trading at 1.315 at the time of writing. Pair opened at 1.3183 and is trading with a change of -0.25% % .
| Overview | Overview.1 | |
|---|---|---|
| 0 | Today last price | 1.315 |
| 1 | Today Daily Change | -0.0033 |
| 2 | Today Daily Change % | -0.25% |
| 3 | Today daily open | 1.3183 |
The pair remains strongly bearish on the daily time frame. It trades below the 20 SMA @ 1.3347, 50 SMA 1.3446, 100 SMA @ 1.3505 and 200 SMA @ 1.3519.
| Trends | Trends.1 | |
|---|---|---|
| 0 | Daily SMA20 | 1.3347 |
| 1 | Daily SMA50 | 1.3446 |
| 2 | Daily SMA100 | 1.3505 |
| 3 | Daily SMA200 | 1.3519 |
The previous day high was 1.3226 while the previous day low was 1.3143. The daily 38.2% Fib levels comes at 1.3194, expected to provide resistance. Similarly, the daily 61.8% fib level is at 1.3175, expected to provide resistance.
Note the levels of interest below:
- Pivot support is noted at 1.3142, 1.3101, 1.306
- Pivot resistance is noted at 1.3225, 1.3267, 1.3308
| Levels | Levels.1 |
|---|---|
| Previous Daily High | 1.3226 |
| Previous Daily Low | 1.3143 |
| Previous Weekly High | 1.3270 |
| Previous Weekly Low | 1.3139 |
| Previous Monthly High | 1.3655 |
| Previous Monthly Low | 1.3315 |
| Daily Fibonacci 38.2% | 1.3194 |
| Daily Fibonacci 61.8% | 1.3175 |
| Daily Pivot Point S1 | 1.3142 |
| Daily Pivot Point S2 | 1.3101 |
| Daily Pivot Point S3 | 1.3060 |
| Daily Pivot Point R1 | 1.3225 |
| Daily Pivot Point R2 | 1.3267 |
| Daily Pivot Point R3 | 1.3308 |
[/s2If]
Nehcap Expert Advisor
The NEHCAP MT4 EA is high quality professional trading system geared to generate returns without using GRID or martingales. Each trade has strict risk per trade parameter. The pairs under management include EURUSD, GBPUSD, AUDCAD, AUDNZD,GBPAUD, EURAUD, EURCAD, CHFJPY and many more.
The system is trading live: LIVE ACCOUNT TRACKING
You can run it free. Apply for a free trial and track our account. Buy the system or use profit share mechanism to generate returns on your MT4.
Join Our Telegram Group
")


