The AUDJPY pair at 95.9250 is experiencing a downward trend below the 96.00 mark, and those who sell are looking towards reaching the 95.00 level.
…
This is a premium post.
[s2If !current_user_can(access_s2member_level4)]Please register for FREE REGISTER to read full post below containing analysis. In case of any error or you think you are not able to read the full post below, please email us at support#nehcap.com [lwa][/s2If] [s2If current_user_can(access_s2member_level1)]
- AUD/JPY sees a bearish trend below 96.00, with sellers eyeing the 95.00 figure.
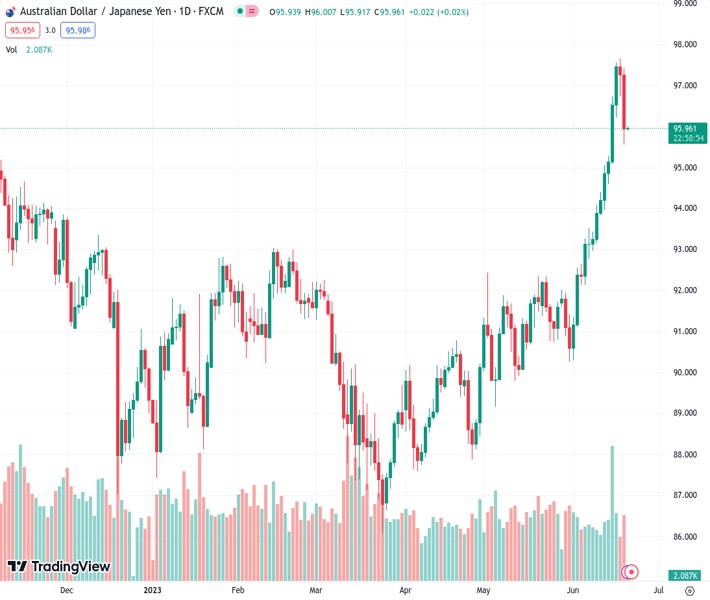
The pair currently trades last at 95.9250.
The previous day high was 97.68 while the previous day low was 96.73. The daily 38.2% Fib levels comes at 97.09, expected to provide resistance. Similarly, the daily 61.8% fib level is at 97.31, expected to provide resistance.
As the Asian session began, the AUD/JPY exchanged hands at around 95.96, following Tuesday’s price action. The AUD/JPY formed a three-candle evening star chart pattern, which suggests further downside action is expected.
From the daily chart perspective, the AUD/JPY remains upward biased in the medium term, but a back-to-back bearish session suggests downside action is warranted. If the AUD/JPY slides past the June 20 daily low of 95.57, that could drive the price toward the Tenkan-Sen line at 95.41. A breach of the latter could tumble the AUD/JPY below the 95.00 handle, exposing the 94.00 figure immediately followed by the Kijun-Sen line at 93.96.
Dropping to the 1-hour chart, the AUD/JPY is set to extend its losses, but support lies at the Tenkan-Sen line at 95.80. Once cleared, the cross would test the 95.57 June 20 low before challenging the S1 daily pivot at 95.20, followed by the S2 pivot at 94.46.
Conversely, if AUD/JPY cracks the 96.00 figure, it would exacerbate a rally toward the bottom of the Ichimoku cloud. The next resistance would be the daily pivot at 96.30, followed by the Kijun-Sen line at 96.49, before testing the bottom of the cloud at around 97.00.
Technical Levels: Supports and Resistances
AUDJPY currently trading at 95.98 at the time of writing. Pair opened at 97.26 and is trading with a change of -1.32 % .
| Overview | Overview.1 | |
|---|---|---|
| 0 | Today last price | 95.98 |
| 1 | Today Daily Change | -1.28 |
| 2 | Today Daily Change % | -1.32 |
| 3 | Today daily open | 97.26 |
The pair remains strongly bullish on the daily timeframe. It trades above its 20 SMA @ 93.23, 50 SMA 91.51, 100 SMA @ 90.87 and 200 SMA @ 91.75.
| Trends | Trends.1 | |
|---|---|---|
| 0 | Daily SMA20 | 93.23 |
| 1 | Daily SMA50 | 91.51 |
| 2 | Daily SMA100 | 90.87 |
| 3 | Daily SMA200 | 91.75 |
The previous day high was 97.68 while the previous day low was 96.73. The daily 38.2% Fib levels comes at 97.09, expected to provide resistance. Similarly, the daily 61.8% fib level is at 97.31, expected to provide resistance.
Note the levels of interest below:
- Pivot support is noted at 96.76, 96.27, 95.81
- Pivot resistance is noted at 97.72, 98.17, 98.67
| Levels | Levels.1 |
|---|---|
| Previous Daily High | 97.68 |
| Previous Daily Low | 96.73 |
| Previous Weekly High | 97.63 |
| Previous Weekly Low | 93.88 |
| Previous Monthly High | 92.44 |
| Previous Monthly Low | 89.16 |
| Daily Fibonacci 38.2% | 97.09 |
| Daily Fibonacci 61.8% | 97.31 |
| Daily Pivot Point S1 | 96.76 |
| Daily Pivot Point S2 | 96.27 |
| Daily Pivot Point S3 | 95.81 |
| Daily Pivot Point R1 | 97.72 |
| Daily Pivot Point R2 | 98.17 |
| Daily Pivot Point R3 | 98.67 |
[/s2If]
Nehcap Expert Advisor
The NEHCAP MT4 EA is high quality professional trading system geared to generate returns without using GRID or martingales. Each trade has strict risk per trade parameter. The pairs under management include EURUSD, GBPUSD, AUDCAD, AUDNZD,GBPAUD, EURAUD, EURCAD, CHFJPY and many more.
The system is trading live: LIVE ACCOUNT TRACKING
You can run it free. Apply for a free trial and track our account. Buy the system or use profit share mechanism to generate returns on your MT4.
Join Our Telegram Group
")


