#USDJPY @ 138.891 clings to mild gains during the first positive day in five., @nehcap view: Bearish (Pivot Orderbook analysis)
…
This is a premium post.
[s2If !current_user_can(access_s2member_level4)]Please register for FREE REGISTER to read full post below containing analysis. In case of any error or you think you are not able to read the full post below, please email us at support#nehcap.com [lwa][/s2If] [s2If current_user_can(access_s2member_level1)]
- USD/JPY clings to mild gains during the first positive day in five.
- Sustained downside break of previous key support, bearish trend channel keeps Yen pair sellers hopeful.
- 100-HMA acts as the last defense of Yen sellers, bumpy road awaits pair sellers on US NFP day.
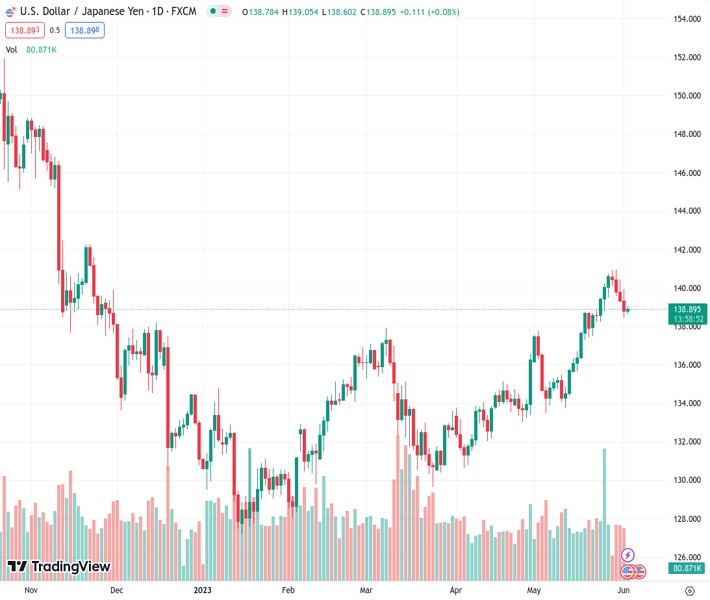
The pair currently trades last at 138.891.
The previous day high was 139.95 while the previous day low was 138.43. The daily 38.2% Fib levels comes at 139.01, expected to provide resistance. Similarly, the daily 61.8% fib level is at 139.37, expected to provide resistance.
USD/JPY struggles to defend the first daily gains in five as it seesaws around 139.00 heading into Friday’s European session, mildly bid near 138.85 by the press time.
The Yen pair’s latest corrective bounce could be linked to the RSI (14) line’s gradual rebound from the oversold territory, as well as the quote’s inability to break the lower line of a bearish channel stretched from Tuesday. The recovery moves also justify the bullish MACD signals.
However, a one-week-old previous support line, close to 139.15 at the latest, restricts the USD/JPY pair’s immediate upside within a short-term bearish channel, currently between 138.35 and 139.50.
Even if the Yen pair manages to deft the immediate bearish chart formation, the 100-Hour Moving Average (HMA) near 139.70, quickly followed by the 140.00 round figure, could challenge the bulls before giving them control.
On the flip side, a clear break of 138.35 will also reject the previously stated bearish channel but in favor of the USD/JPY sellers. Following that, the quote could drop to the May 19 swing low of around 137.40.
It’s worth noting that the 50% and 61.8% Fibonacci retracement level of the pair’s moves between May 11 and 30, around 137.30 and 136.50, could challenge the bears afterward.
Apart from the aforementioned technical details, the Yen pair’s risk-barometer status also justifies the pair’s latest inaction as the markets await the US employment report.
Also read: Forex Today: US Dollar struggles to find demand, all eyes on NFP
Trend: Bearish
Technical Levels: Supports and Resistances
USDJPY currently trading at 138.92 at the time of writing. Pair opened at 138.79 and is trading with a change of 0.09% % .
| Overview | Overview.1 | |
|---|---|---|
| 0 | Today last price | 138.92 |
| 1 | Today Daily Change | 0.13 |
| 2 | Today Daily Change % | 0.09% |
| 3 | Today daily open | 138.79 |
The pair remains strongly bullish on the daily timeframe. It trades above its 20 SMA @ 137.61, 50 SMA 135.13, 100 SMA @ 133.84 and 200 SMA @ 137.28.
| Trends | Trends.1 | |
|---|---|---|
| 0 | Daily SMA20 | 137.61 |
| 1 | Daily SMA50 | 135.13 |
| 2 | Daily SMA100 | 133.84 |
| 3 | Daily SMA200 | 137.28 |
The previous day high was 139.95 while the previous day low was 138.43. The daily 38.2% Fib levels comes at 139.01, expected to provide resistance. Similarly, the daily 61.8% fib level is at 139.37, expected to provide resistance.
Note the levels of interest below:
- Pivot support is noted at 138.16, 137.54, 136.64
- Pivot resistance is noted at 139.69, 140.58, 141.21
| Levels | Levels.1 |
|---|---|
| Previous Daily High | 139.95 |
| Previous Daily Low | 138.43 |
| Previous Weekly High | 140.72 |
| Previous Weekly Low | 137.49 |
| Previous Monthly High | 140.93 |
| Previous Monthly Low | 133.50 |
| Daily Fibonacci 38.2% | 139.01 |
| Daily Fibonacci 61.8% | 139.37 |
| Daily Pivot Point S1 | 138.16 |
| Daily Pivot Point S2 | 137.54 |
| Daily Pivot Point S3 | 136.64 |
| Daily Pivot Point R1 | 139.69 |
| Daily Pivot Point R2 | 140.58 |
| Daily Pivot Point R3 | 141.21 |
[/s2If]
Nehcap Expert Advisor
The NEHCAP MT4 EA is high quality professional trading system geared to generate returns without using GRID or martingales. Each trade has strict risk per trade parameter. The pairs under management include EURUSD, GBPUSD, AUDCAD, AUDNZD,GBPAUD, EURAUD, EURCAD, CHFJPY and many more.
The system is trading live: LIVE ACCOUNT TRACKING
You can run it free. Apply for a free trial and track our account. Buy the system or use profit share mechanism to generate returns on your MT4.
Join Our Telegram Group
")


