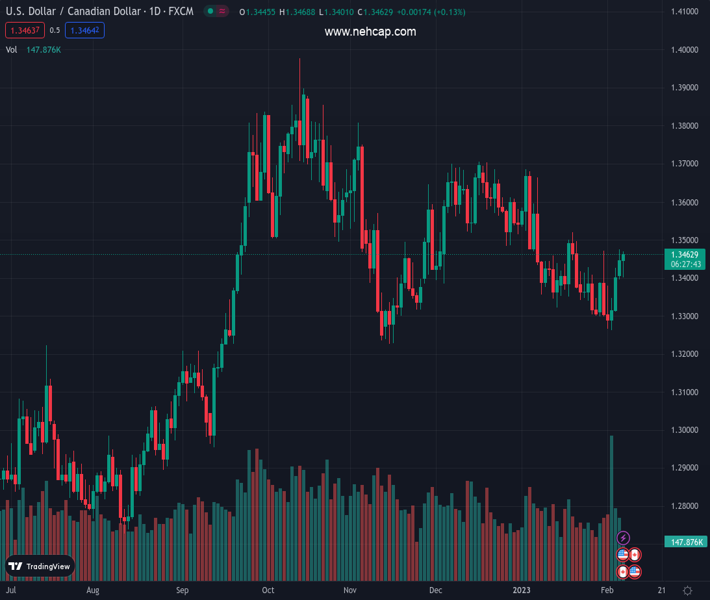
#USDCAD @ 1.34626 holds to gains as traders brace for Federal Reserve Chair Jerome Powell’s speech. (Pivot Orderbook analysis)
…
This is a premium post.
[s2If !current_user_can(access_s2member_level4)]Please register for PREMIUM VERSION HERE to read full post below containing analysis. In case of any error or you think you are not able to read the full post below, please email us at support#nehcap.com [lwa][/s2If] [s2If current_user_can(access_s2member_level4)]
- USD/CAD holds to gains as traders brace for Federal Reserve Chair Jerome Powell’s speech.
- The US trade deficit widened, though market participants ignored it.
- Bank of Canada’s Governor Tiff Macklem will cross wires later.
The pair currently trades last at 1.34626.
The previous day high was 1.3476 while the previous day low was 1.3397. The daily 38.2% Fib levels comes at 1.3446, expected to provide support. Similarly, the daily 61.8% fib level is at 1.3427, expected to provide support.
The USD/CAD prolongs its gains to four straight days, though it remains below the weekly high of 1.3475, meandering around 1.3460, after hitting a daily low of 1.3401, shy of the 20-day Exponential Moving Average (EMA) at 1.3399. At the time of typing, the USD/CAD exchanges hands a 1.3457, registering minuscule gains of 0.08%.
Wall Street opened in the red, except for the Nasdaq 100. Traders are preparing for the US Federal Reserve (Fed) Chair Jerome Powell’s speech at the Washington Economic Club around 17:00 GMT. Investors are looking for Powell’s pushback following a strong jobs report released last Friday that witnessed the US economy adding 517K jobs in January vs. expectations of almost 200K. Consequently, the Unemployment Rate dived to 3.4% from 3.5%. All-in-all such a tight labor market would warrant further tightening by the Fed.
Data-wise, the US Commerce Department revealed the trade deficit widened 10.5% to $-67.4B compared to November’s $-61.0B, but below the market’s expectations of $-68.5B.
Elsewhere, Minnesota Fed President Neil Kashkari crossed wires and commented that he foresees the Federal Fund rate at around 5.4% due to the stronger-than-expected labor market report, which showed that the US central bank needs to keep raising rates. He added that “No one should overreact to one report,” but added that the strength of the services sector is still very robust, and “that’s where I think a lot of us are focusing our attention.”
In the meantime, the US Dollar Index, which tracks the buck’s performance against six currencies, continues to record gains, up 0.28% at 103.910, a tailwind for the USD/CAD pair. Nevertheless, Crude Oil prices remain underpinned following an earthquake in Turkey and Syria, which disrupted one of Turkey’s ports that exported around 1% of global supplies in January. Therefore, WTI exchanges hands at $75.47, up 1.44%, capping the USD/CAD rally.
Aside from this, Statistics Canada revealed its trade balance narrowed, compared to December’s data, as lower Crude Oil prices weighed on energy export and imports of consumer goods fell, according to Reuters. Also, USD/CAD traders could get some cues from Bank of Canada (BoC) Governor Tiff Macklem, which would cross newswires around 17:30 GMT. Given that the BoC announced a pause after lifting rates to 4.50%, it could weigh on the Loonie (CAD). Therefore, any dovish hints could pave the way for further upside in the USD/CAD, though capped by rising Oil prices.
Technical Levels: Supports and Resistances
USDCAD currently trading at 1.3465 at the time of writing. Pair opened at 1.3443 and is trading with a change of 0.16 % .
| Overview | Overview.1 | |
|---|---|---|
| 0 | Today last price | 1.3465 |
| 1 | Today Daily Change | 0.0022 |
| 2 | Today Daily Change % | 0.1600 |
| 3 | Today daily open | 1.3443 |
The pair is trading above its 20 Daily moving average @ 1.3383, below its 50 Daily moving average @ 1.3498 , below its 100 Daily moving average @ 1.3536 and above its 200 Daily moving average @ 1.3225
| Trends | Trends.1 | |
|---|---|---|
| 0 | Daily SMA20 | 1.3383 |
| 1 | Daily SMA50 | 1.3498 |
| 2 | Daily SMA100 | 1.3536 |
| 3 | Daily SMA200 | 1.3225 |
The previous day high was 1.3476 while the previous day low was 1.3397. The daily 38.2% Fib levels comes at 1.3446, expected to provide support. Similarly, the daily 61.8% fib level is at 1.3427, expected to provide support.
Note the levels of interest below:
- Pivot support is noted at 1.3401, 1.3359, 1.3322
- Pivot resistance is noted at 1.348, 1.3517, 1.3559
| Levels | Levels.1 |
|---|---|
| Previous Daily High | 1.3476 |
| Previous Daily Low | 1.3397 |
| Previous Weekly High | 1.3472 |
| Previous Weekly Low | 1.3262 |
| Previous Monthly High | 1.3685 |
| Previous Monthly Low | 1.3300 |
| Daily Fibonacci 38.2% | 1.3446 |
| Daily Fibonacci 61.8% | 1.3427 |
| Daily Pivot Point S1 | 1.3401 |
| Daily Pivot Point S2 | 1.3359 |
| Daily Pivot Point S3 | 1.3322 |
| Daily Pivot Point R1 | 1.3480 |
| Daily Pivot Point R2 | 1.3517 |
| Daily Pivot Point R3 | 1.3559 |
[/s2If]
Join Our Telegram Group
")


